
DOI:https://doi.org/10.34069/AI/2022.51.03.9
Using Space Syntax Technique to Enhance Visual Connectivity in Hospitals
Abstract
The design of healthcare buildings as hospitals is a rather complex architectural task and is being considered as projects of high cost, but indispensable, given their role in preserving human health. The sustainability of services offered by healthcare projects is a paramount necessity for human societies; therefore, in addition to architectural standards applied in a design process, new tools are introduced by the space syntax community in the form of specified programs to provide an advanced method of assessing the effectiveness of any design configuration.
This research aims to evaluate the effect of applying the software of (Depthmap X) on a selected new hospital design to measure the nature of visual communication between the different wards of the most active floor (the ground floor) and the connectivity of various kinetic systems of the ground floor with the main entrances.
The paper identifies the efficiency of the hospital performances in terms of visual connectivity. It also shows that a slight change made in the hospital configuration in the design alternatives could lead to a significant impact on the visual relationship between the hospital domains.
Keywords: Space Syntax, Depthmap X, Hospital Design, Visual Connectivity, Design Enhancing.
Introduction
Hospital building designs follow numerous standards and regulations and take into account a variety of economic, social, and cultural factors in their environment, making them one of the most complex design processes. As a result of technological advancements, hospitals' design and operations evolve continuously. As a result, the design process for hospital buildings must include analytical stages that will reinforce design decisions.
Due to the complexity of the kinetic system of hospital buildings (Pachilova, 2015), it suffers from a fundamental problem of wayfinding, especially on the ground floor, which is the most effective floor in the hospital. Most designers usually research and redesign the spatial configuration multiple times to make this system as easy as possible for patients. Designing a recognizable spatial arrangement with a simple structural pattern and even providing indicative signs guiding the routs, to specify visual fields, which conversely determine the circulation fields of users are the most challenging duties of hospital design. Here comes the importance of resorting to the meaning of visual communication as a dominant factor in organizing and designing main functions in hospitals. Dalton (2001) defines it as a measure of the number of direct visual contacts to enhance the way occupants use the building.
The World Health Organization (WHO) and international standards emphasize the importance of creating a visual organization between the parts of any hospital to ensure visual fluidity, which in turn ensures the flow of circulation (Rosenfield, 1971). The absence of this organizational factor results in unpleasant reactions that affect the patient who moves within the building and provoke a sense of isolation or loss, and thus affects the hospital efficiency as a whole. Visual isolation is a crucial criterion required for design processes of health care units (Antony & Philip 1990) especially hospitals, to determine the visual area of what the patient sees, and determine the functional areas in which the patient can move. The high visual contact between the wards, which require an amount of isolation, will necessarily lead to their physical connection with each other and thus require the creation of insulators and obstacles to limit the movement of patients that will affect the functionality of those wards (Rosenfield, 1971).
This study aims to measure the nature of visual communication between the different wards on the active floors (ground floor) of hospitals on one hand, and the connection of different systems within those floors with the main entrances on the other hand. To assess, the amount of isolation provided by the chosen space configuration between different hospital wards (Fig 1).
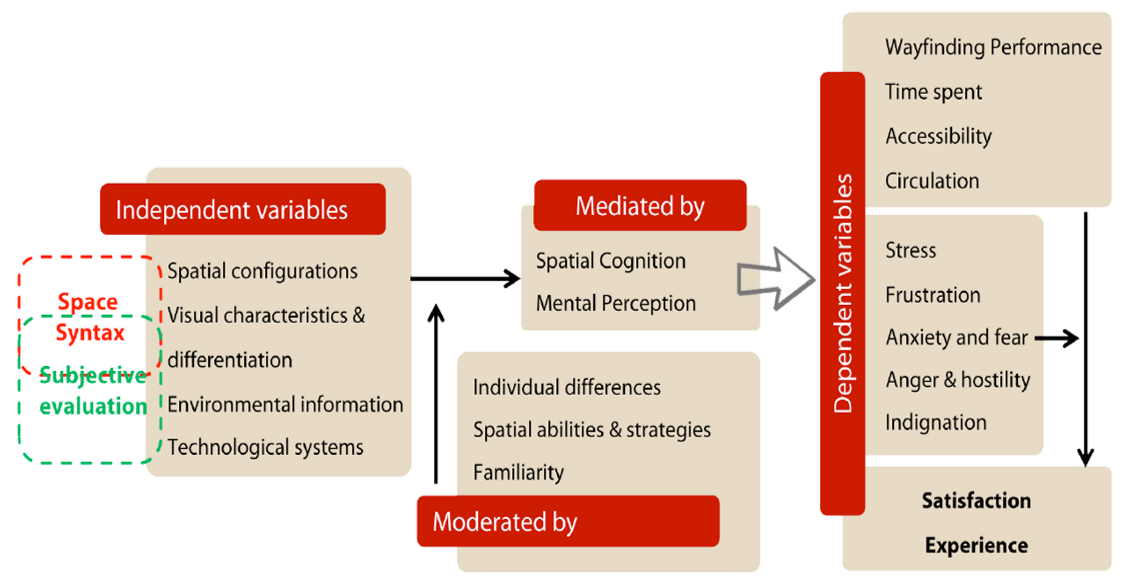
Figure 1. Illustrates the relationship between the measures of visual communication identified by Bill Hillier and the performance of hospitals (Sadek, 2015).
Table 1.
Hospitals Standards Design Consideration (Researcher according to World Health Organization (WHO), 1996).
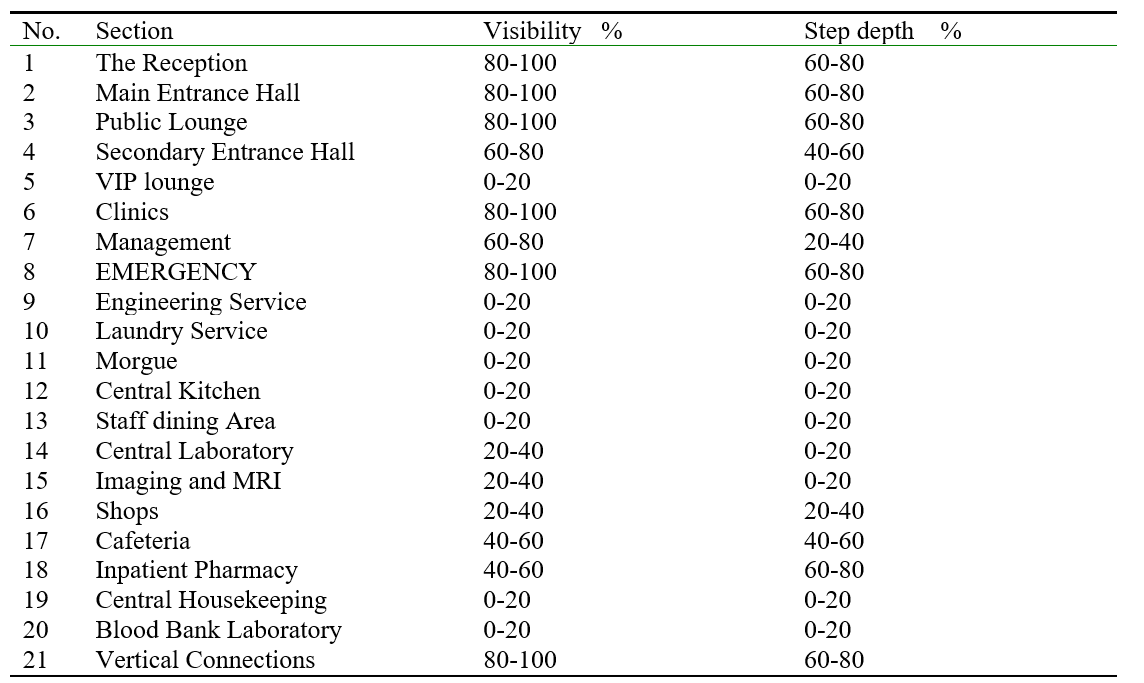
Different analyses offered by the (Depthmap X) software are applied, and finally determining the efficiency of hospitals' performance (Sadek, 2015). Based on the instructions of the (WHO) and hospital design considerations (World Health Organization (WHO), 1996), a set of criteria are addressed, which will be adopted in the practical part of the research as extracted in (Table. 1).
Theoretical Framework
Depthmap X Software
(Depthmap X) is a visual and spatial network analysis software that can be used at various levels, ranging from a single building layout to an entire city (SSN). The software generates a map of spatial elements and connects them using visual network relationships such as visibility, intersection, or adjacency, followed by various conclusions drawn using graph analysis of the resulting network. The analysis objective is to derive variables that may have social or experiential significance. The software is developed by Alasdair Turner (Pachilova, & Sailer, 2020) from the Space Syntax group and is now available as open source. The basic idea of the program crystallized from two points of view:
Isovist analysis (Benedikt, 1979): Benedikt created isovist diagrams of the visual field at specific points within the system. He highlighted the boundaries of equal visual areas within the system where Benedikt believed that these diagrams would give a clear view of how people move and experience the system. He emphasized the overlapping visual areas which refer to the decision points inside the building because they express the rapid change in the visual field.
Space Syntax (Hillier & Hanson, 2009): Hillier and Hanson produced multiple graph analyses of the space components. For instance, Visibility graph Analysis VGA, Step Depth graph Analysis, and Axial Analysis, including Connectivity Analysis and Line Length. These analyses are the results of a critical study of relationships of space components with each other, performing a graph analysis of the resulting network. It is worth mentioning most frequently used type of analysis is the axial map.
Among many Analyses offered by the program, the following was of interest to the research problem.
1. Visibility graph analysis (VGA):
The VGA represents analyzing a grid of points spread throughout the plan by making a graph of each visible point connected to every other point in that system. The analysis will give a good indication of how people might interact with a space by moving through (Desyllas & Duxbury, 2003) or standing, discussing, and generally occupying it (Turner, 2004a). Isovists are the core element behind Visibility Graph Analysis (VGA), acting as the joining mechanism that converts a dense grid to a graph of indivisible points (a visibility graph), which may then be analyzed using various graph measures. (Depthmap X) provides local measures of visibility such as the isovist area and perimeter. In addition to that global ones quantify building traversal and space centrality (Turner, 2004a).
2. Step Depth graph Analysis:
The visual integration of any point is determined by the number of visual steps required to move from one point to another within a given configuration. (Depthmap X) simulates various types of pedestrian behaviour by allowing an agent to choose where to walk, such as towards larger spaces, long lines of sight, or occluded parts of their view. The paths of the agents and their numbers passing through gates can be counted, and compared to the actual behaviour of pedestrians passing through gates (Turner, 2004a).
3. Axial analysis:
As previously stated, this is the most popular but also the most complex analysis, consisting of drawing a group of lines throughout any open area in any given configuration. Hillier and Hanson's notable addition was to consider the nodes formed by line intersections as a connection between the two lines. As a result, calculating the number of steps required to connect one line to any other line drawn on the axial map determines the line's integration with the entire system. The integration of axial lines is of particular interest to researchers as it correlates well with the number of users found to be walking along the axial line (Hillier & Hanson, 2009). Among many attributes of Axial Analysis two are chosen, which are serving the research problem.
- Connectivity Analysis: Analyze the integration/segregation of a route to the whole system utilizing a direct connection of nodes to each node (Nubani, & Wineman, 2005).
- Line Length: Analyze how easily a route is accessible by calculating the number of turns made (Nubani, & Wineman, 2005).
Axial maps can also be converted to segment maps by segmenting long axial lines into a series of segments that connect junctions. These can be analyzed using many depth-accumulating techniques, such as the degree of angle change from one segment to the next, metric distance, or segment steps. Calculating the number of shortest angular paths through a segment or the average metric distance from each segment to all others are two examples (Nubani, & Wineman, 2005). The segment analysis is not taken into account in this paper.
Methodology
Visibility and Step Depth analysis measure the number of direct visual connections occurring in the system but Connectivity and Line length analysis measures the physical integration or separation as both kinds of communication enhance the way occupants use the building. That significantly affects the use of active social spaces such as the foyer space in public areas and increases the value of spaces by strengthening or limiting (as needed) the visual and physical connections between different parts (Hatfield, 2012). Visual and physical communication also adds perceptions of a new level and provides new experiences in the visual environment of different spaces through the spatial arrangement of these spaces. As so it is possible to control the flow of occupants by promoting a sense of movement in certain spaces or a sense of limitation in other spaces, thus emphasizing the spatial planning characteristics of hospitals. In this study, four different types of graphical analyzes will be executed on the project of Faruk Medical City FMC in Sulaymaniyah city.
Faruk Medical City (FMC)
The case study is a realistic model, and it is considered the largest and most modern hospital in Sulaymaniyah City (FMC), lending more validity to the study. Farouk Medical City was established in Sulaymaniyah in 2015 on an area of 7 hectares and a total of 7 floors with international specifications (FMC). The FMC includes 210 beds, 11 advanced operating rooms, 21 modern suites outfitted with world-class medical equipment, 3 presidential suites equipped with devices for the disabled, 6 open-heart intensive care beds, 6 general intensive care beds & 6 coronary care beds, 5 neonatal (premature new-born) intensive care beds, More than 190 high-calibres and board-certified physicians.
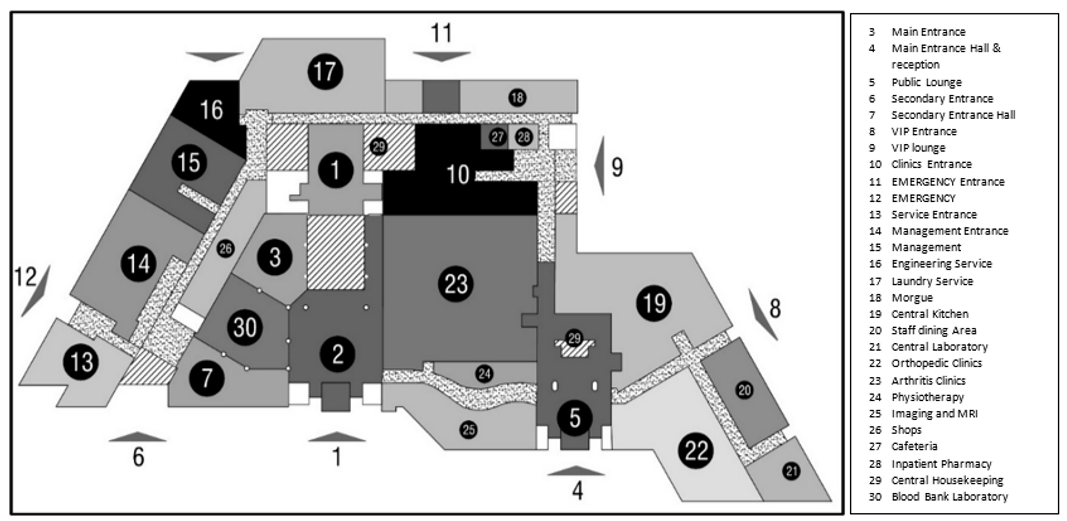
Fig. 2. Faruk Medical City (FMC) ground floor plan (Researcher according to (about FMC, 2021).
The design of the building is a central space organization, in which activities revolve around a central focus point, and then the pattern turns into a closed-loop (Fig. 2). This design approach is appropriate for sites with limited space and is more efficient than other patterns such as linear or radial organization in terms of isolating activities from one another, but it is not in terms of concentrating all activities around a single focal point, which limits the ability to establish specific visual fields for different areas (Pachilova, 2015).
Since entrances are the first spatial elements that a person encounters when entering any building, the first impression is made, which is very important in sensing the functions it leads. There are some considerations identified by the World Health Organization in the design of hospital entrances (FMC). First, the movement sequence must be observed, second the visual communication between the entrance and the major spaces that a patient needs when entering from the main gate. Hospital often has separate entrances for horizontal and vertical movement lines. In the chosen model, there are eight entrances, namely, the Main Entrance, Secondary Entrance, VIP Entrance, Clinics Entrance, Emergency Entrance, Service Entrance, Morgue Entrance, and Staff Entrance.
In this study, the focus will be on the main entrance of patients and visitors, due to its importance. The relationship between the person's visual range while entering the main entrance and the hospital spaces will be measured, besides the relationship between the main entrance and the other secondary entrances).
The study is divided into four stages to accomplish the objectives:
- Creating an abstract plan for the (FMC) ground floor using AutoCAD, which aids in clarifying the areas of the hospital under study, stripping the schemas of unnecessary details and preparing them to meet the requirements of (Depthmap X) for producing graphic analysis, and stripping the structural elements and converting the individual functional spaces to numbered readable domains (Fig. 2).
- Applying four kinds of analysis to the effective floor plan will help in clarifying the topography of visual communication.
- The previous four Analyses will present a specific pattern of the nature of functional overlap based on visual communication and the relationship with the entrance, which helps in reaching analytical procedures as follows:
a) Comparing the values of the case study and the basic criteria that the research has already extracted, which clarify the relationships between hospital districts.
b) Comparing the relationship of each domain with the entrance, which is also determined by standards, to know the amount of functional overlap and the level of priority in communication between the domains and the entrance.
Results and Discussion
A- The first stage: Analyzing the actual existing configuration of the mentioned scheme’s ground floor, as all the corridors and links between different departments of the hospital are separated with closed private doors that clearly define the visual and physical communication between the main entrance and the departments and between departments. Four types of these analyses will be applied as follows:
- Visibility graph Analysis VGA: The visibility grid represents a sensible choice of spacing related to the maximum dimension of the existing configuration ranging from ten times. This sensible choice to one-tenth of it, in this case, we chose [0.7m x 0.7m]. Then produce the visibility graph calculation from the very centre of the grid square of these locations, and finally analyse the graph at eye level.
- Step depth graph Analysis: by selecting a specific location inside the configuration to calculate the distance of every single node one step away from our selected location point, which will be considered as directly visible from that location and measured at depth one, then everything visible from that at depth two…etc. The analysis is consisting of the visual depth of each point calculated by the ‘shortest path’ throughout the graph, worth mentioning that all those nodes are falling in the isovist of the starting point [the polygon which contains all the visible area from a particular location] (Benedikt, 1979).
- Connectivity Analysis: which is mentioned by (Hillier, & Hanson, 2009). To run the analysis, Depthmap needs first to realize the big open spaces or wide streets being prioritised in terms of integration (Turner, 2001b). Accordingly, the integration/ segregation will be measured and evaluated as some routes of the hospital should have much higher integration than others.
- Line Length: The second attribute of Axial map analysis depending on the idea of the fewest number of turns needed is the shortest path. Accordingly, the shortest path represents the easiest route available.
The values generated from Depth map X are measured by d-value [meant to represent the fact that axial map graphs grow] (Hillier, & Hanson, 2009). To have a comparable system and make the measurements clearly defined we had to apply the principle of normalisation since each analysis produced a different range of values. All the d values are turned into percentages to uniform the quantities.
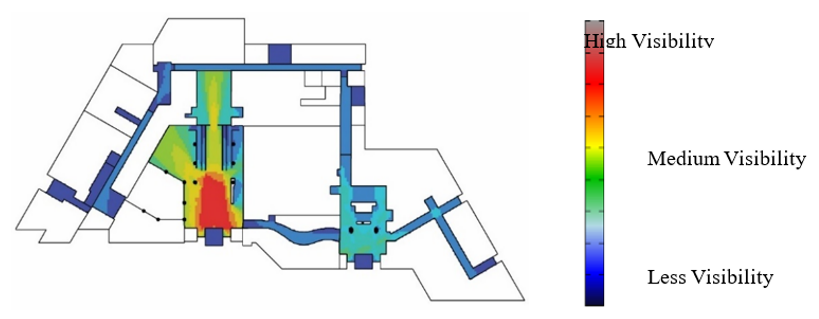
Fig 4. Visibility Analysis of Actual Configuration (Researchers)
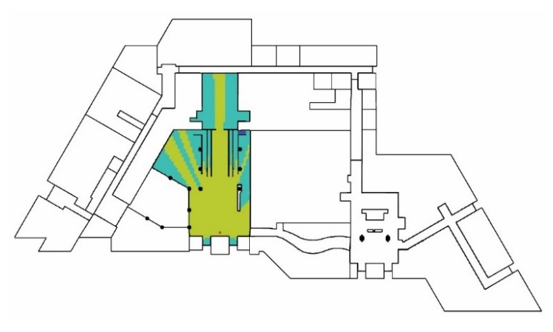
Fig 5. Step depth Analysis of Actual Configuration (Researchers)
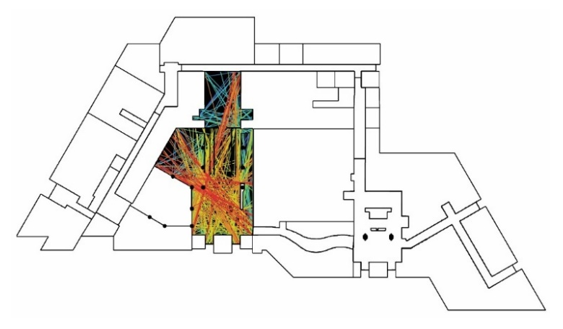
Fig 6. Connectivity Analysis of Actual Configuration (Researchers)
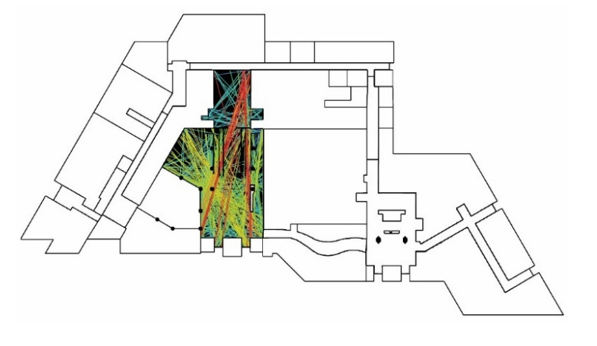
Fig 7. Line Length Analysis of Actual Configuration (Researchers)
Table 2.
b values conducted by analyzing the actual configuration (Researchers)
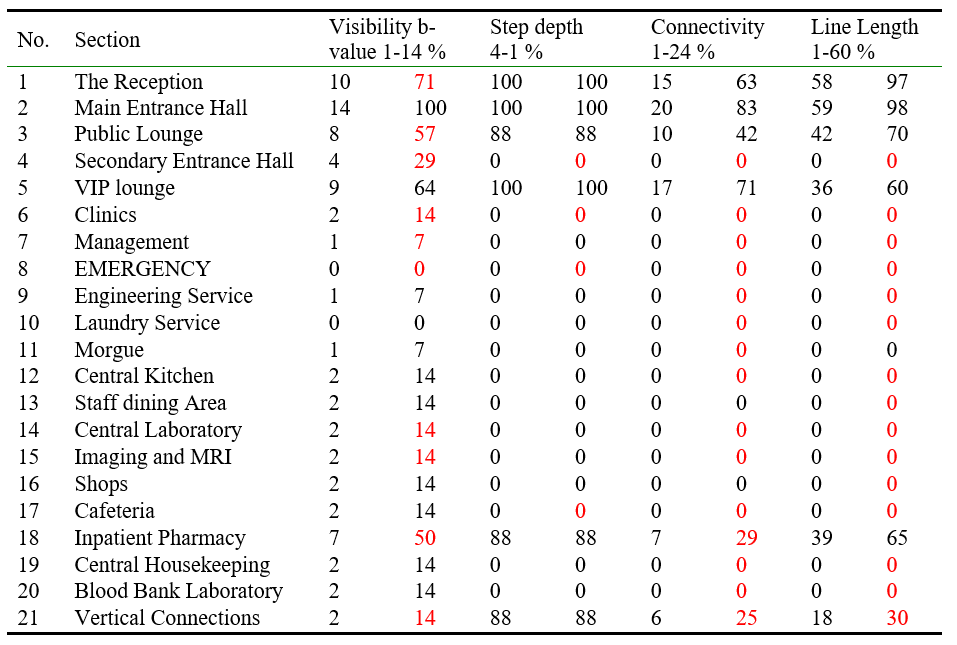
The Visual Step Depth Analysis, Physical Integration / Separation Analysis, and Line Length Analysis are shown in (fig 4,5,6, & 7). A comparison between the visual b-values of the case study and the values of standard criteria that the research extracted from previous studies as well as the relationship of each domain with the entrance is made, to define the amount of functional overlap and degrees of priority in visual communication (Table.2).
B- The second stage: testing three different levels of design alternatives as follows:
- Spatial Adaptation
A basic level of modification through simply opening the existing doors separating each segment inside the given configuration to allow vision possibility (Fig 8,9,10, & 11), the results showed a change in the visual integration (Table 3), as values of visual and physical communication of the hospital areas with the entrance increased slightly, which means that those adaptations that are taken, made a simple change In the visual and physical connection.
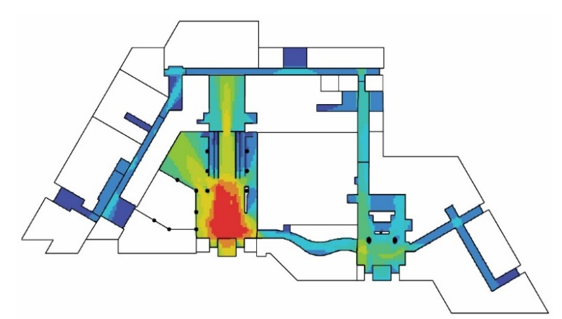
Fig 8. Visibility Analysis of Spatial Adaptation (Researchers)
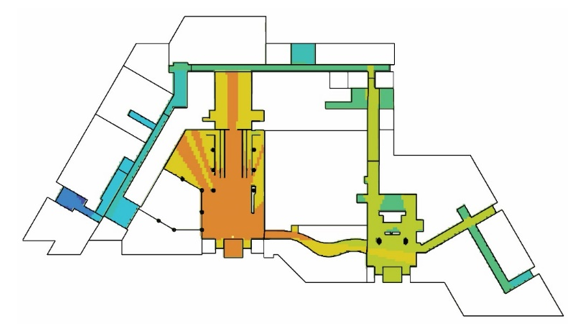
Fig 9. Step Depth Analysis of Spatial Adaptation (Researchers)
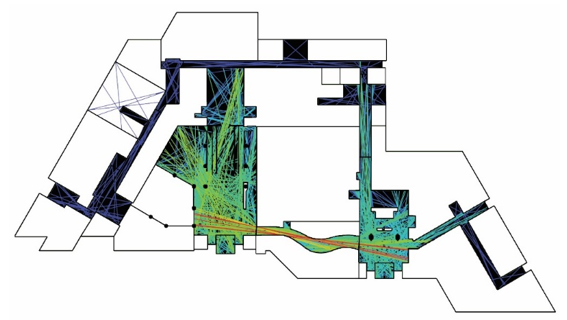
Fig 10. Connectivity Analysis of Spatial Adaptation (Researchers)
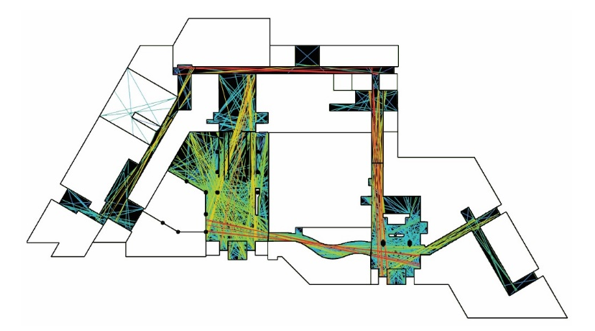
Fig 11. Line Length Analysis of Spatial Adaptation (Researchers)
Table 3.
b values conducted by analyzing the Spatial Adaptation (Researchers)

- Spatial Reconfiguration
Spatial reconfiguration is a level that contains a medium degree of modification while preserving the external shape of the building. The modification should be in a way that ensures increasing the level of communication for the patient and includes the following (Fig.12):
- Rotating the reception element 90 degrees.
- Rotating the vertical connection 90 degrees.
- Increasing the width of the connecting corridor between the primary & secondary entrance, eventually leads to more openness and more visibility between the two entrances.
- More space is opening at the clinic's entrance.
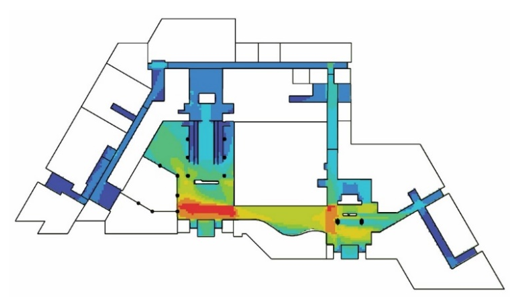
Fig 12. Line Length Analysis of Spatial Adaptation (Researchers)
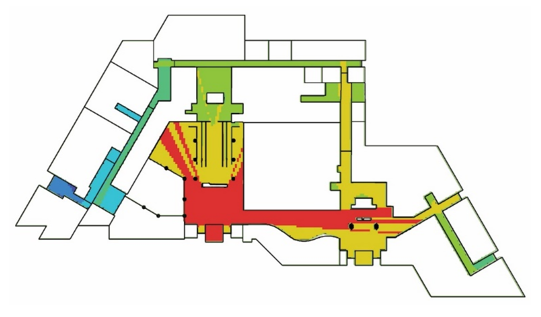
Fig 13. Step Depth Analysis of Spatial Adaptation (Researchers)
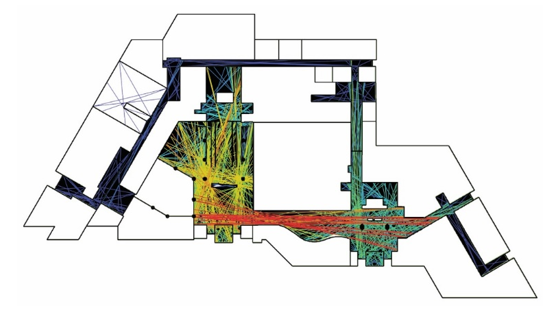
Fig 14. Connectivity Analysis of Spatial Adaptation (Researchers)
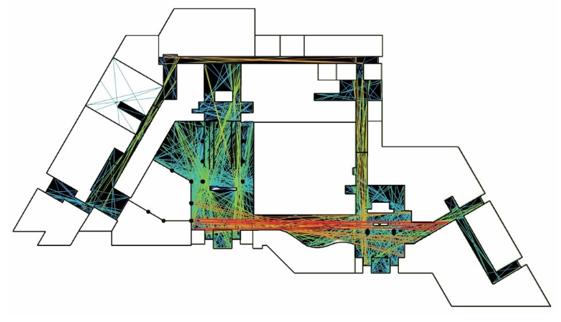
Fig 15. Line Length Analysis of Spatial Reconfiguration (Researchers)
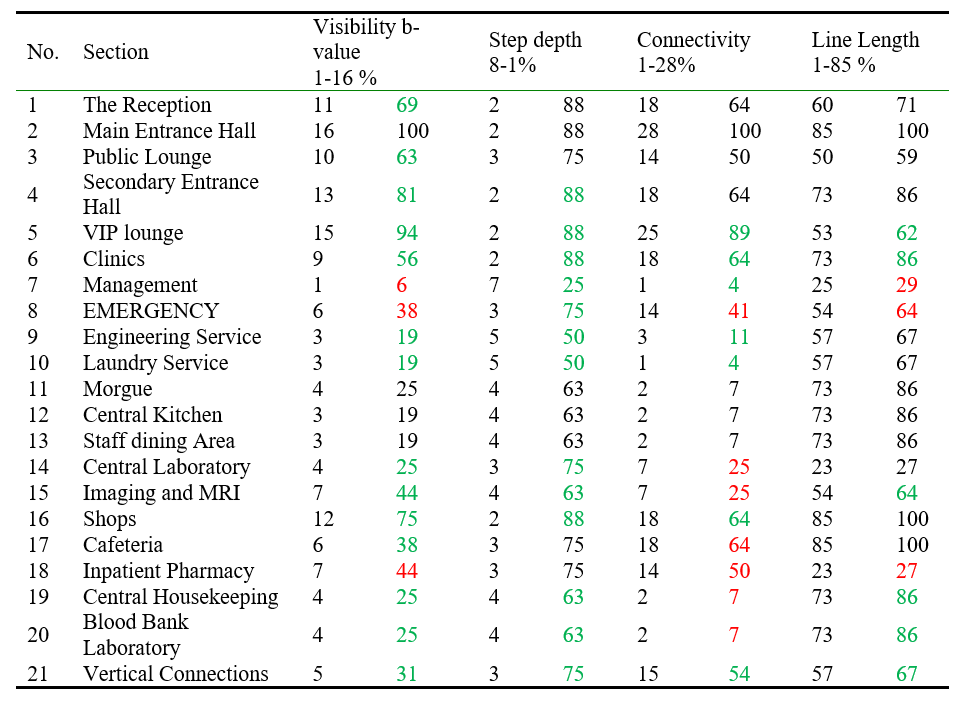
After performing the second level of spatial reconfiguration (Figure No.12, 13, 14, & 15) and according to the same procedures explained previously, the results showed a higher improvement in the visual and physical integration (Table 4). The values of visual and physical communication between the hospital domains and the entrances increased (large-sized numbers) compared with the first level which indicates that applying such a modification makes it easier for visitors to realize the scheme and thus move to those activities without visual obstacles and eventually increase the efficiency of the scheme's performance in general.
Table 4.
b values conducted by analyzing the Spatial Reconfiguration (Researchers)
- Spatial Rearrangement
This includes changing the locations of the hospital departments while preserving the general shape of the building. The rearrangement includes: switching the location of the Shops with the location of the Pharmacy and switching the location of Emergency with the location of the VIP Lounge and Management.
Table 5.
b values conducted by analyzing the Spatial Rearrangement
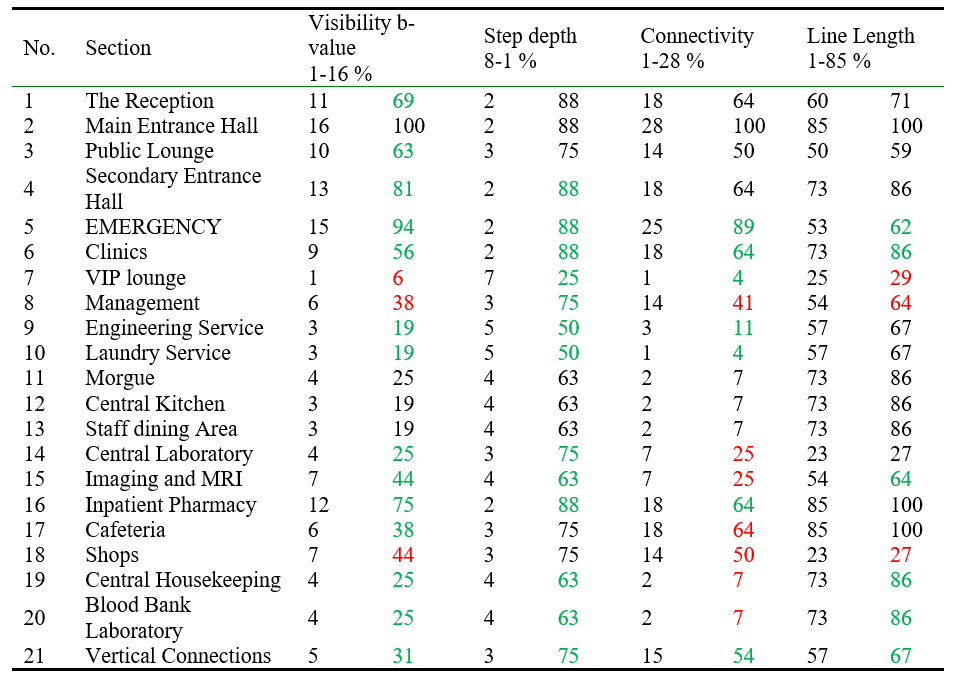
Table 5 shows that the high values of visual and physical communication belong now to the more critical functions in the hospital and the low values belong to less critical functions in terms of a visual and physical connection.
Conclusions
The research shows the importance of visual communication as a critical factor in realizing complicated scheme of Hospitals by patients, and thus their ability to deal with those schemes easily and conveniently, which lead to increasing the efficiency of hospital system performance as a whole. The effectiveness of the scheme helps in managing those hospitals without the need to put up many obstacles or signs or alerts which the World Health Organization (WHO) focused on in its charters, in which it evaluates the health sector's building efficiency. The following recommendations are concluded:
- Neglecting the visual connectivity as a design consideration in hospitals can lead to serious design consequences in terms of confusing the internal circulation that will affect the use of those spaces by patients, especially those who do not have experience or prior knowledge of the building’s scheme.
- The permeability and visual integrity are supposed to be at the forefront of design determinants that are taken into consideration when designing a hospital’s most effective level (the public floor) since they contain main activities related to outpatients and visitors, who often don't have much knowledge of the building.The study shows the cruciality of a clear relationship between the entrance lobby as the main space and the rest of the spaces in terms of visual and physical connectivity. Therefore, designers must choose suitable locations for entrances and their visual connectivity with other activities considering the patient's weak physical condition having no ability to walk long distances or search for the space he needs.
- Designers have to deal with visual connectivity as a design consideration in isolating other spaces that have limited uses by patients; therefore, the level of visual integration must be according to the degree of space’s generality in the hospital.
- A slight change made in the hospital configuration as shown in the design alternatives could lead to a significant impact on the visual relationship between the hospital domains. Leading to raising the building's functional performance. Therefore, a designer must consider using a tool such as the one used in this research (Depthmap X) in the initial design stages.