
DOI:https://doi.org/10.34069/AI/2021.48.12.30
Data Mining Techniques with Electronic Customer Relationship Management for Telecommunication Company
Técnicas de Minería de Datos con Gestión Electrónica de Relación con Clientes para Empresa de Telecomunicaciones
Aldeen Yousef Rashid Hmoud127
Abstract
Organizations must improve decisional quality, and the continuous usage of data mining techniques is a crucial issue for management. This issue mostly involves an individual's motivation to engage in the behavior. This could perhaps be characterized in terms of the working regimen. technology utilization and employee activity are the two main difficulties that this dilemma revolves around. This study aims to address the aspect associated with data mining and E-CRM in the telecom industry. The methods that are used in the current study, analysis studies of the data mining techniques are applied to E-CRM that has been identified. Moreover, PHP with the update of the DeLone and McLean methods has been used in the current study. The results show the significance in affecting the continuance used intention of data mining techniques. User satisfaction, technology, and data mining are critical predictors of employment intentions.
Keywords: Data Mining, E-CRM, Employee, A Telecommunication Company.
Resumen
Las organizaciones deben mejorar la calidad de las decisiones, y el uso continuo de técnicas de minería de datos es un tema crucial para la gestión. Este problema involucra principalmente la motivación de un individuo para participar en el comportamiento. Esto quizás podría caracterizarse en términos del régimen de trabajo. la utilización de la tecnología y la actividad de los empleados son las dos principales dificultades en torno a las cuales gira este dilema. Este estudio tiene como objetivo abordar el aspecto asociado con la minería de datos y E-CRM en la industria de las telecomunicaciones. Los métodos que se utilizan en el estudio actual, los estudios de análisis de las técnicas de minería de datos se aplican al E-CRM que se ha identificado. Además, en el presente estudio se ha utilizado PHP con la actualización de los métodos DeLone y McLean. Los resultados muestran la importancia de afectar la intención de continuación de las técnicas de minería de datos. La satisfacción del usuario, la tecnología y la extracción de datos son predictores críticos de las intenciones de empleo.
Palabras clave: Minería de Datos, E-CRM, Empleado, Empresa de Telecomunicaciones.
Introduction
Due to advances in information technology, data usage has increased at a phenomenal rate during the past two decades. Simultaneously, data mining has progressed tremendously. Several novel approaches and techniques have been adopted to analyze the data and acquire information. The data obtained from any resource is unprocessed data that conceals important information. The practice of collecting useful information from data is known as data mining. Data mining algorithms have been successfully used in a variety of fields. Employee turnover is the most challenging challenge faced by the telecommunications sector Employee turnover algorithms are designed to identify consumers who are likely to switch or quit a service provider (Pallant, 2013). The telecommunication company can identify employees who are likely to churn using a database of potential churners and implement retention measures to minimize the percentage of employees who churn. The retention of skilled employees is often the company's preferred option (Kuegler et al., 2015). An employee who has been with a company for a long period generates stronger growth and is less susceptible to rival performance. Employees like this are also less expensive to retain and provide important word-of-mouth marketing for the company by introducing company services (Saeed, 2014). To prevent telecommunication company sector losses, algorithms must be created to detect employees who are going to turn over and their causes for turnover. The following is a breakdown of the paper's structure (Pang et.al 2009). The idea of electronic customer relationship management (E-CRM) and employee churn in the telecommunications company are discussed in guided by the significant economic benefit of client retention in the telecommunications market.
Several studies have analyzed the continuous use of information systems (IS) in diverse environments. Nevertheless, they do not consider the problem of continuous usage of data mining techniques, such as Internet-based technology and classical IS. As previously indicated, data mining is a decision-supporting technology technique employed by service providers (Pang et.al 2010). Task employees (Chen et al., 2012; Huang et al., 2012) and (Huang et.al 2013) and technology behavior are two important challenges for employee motivation to continue using data mining techniques (Lee 2004; Foshay & Taylor, 2007). Furthermore, because data mining techniques need to be chosen, employee behavior is a prominent concern in studies evaluating the behavior of continued usage (Anaam et al., 2021). Concerning their many characteristics, the outcomes of these studies all revealed a positive significant influence on the intention to continue using IS. Experimentally, this suggests that combining these viewpoints can improve the evidential support for the intention and use it for a long time. On the other hand, this research aims to measure the true value of data mining with E-CRM, which academic studies have delivered to telecommunications companies. For the above, we highlighted two research questions:
RQ1: What percentage of the academic literature highlights data mining with E-CRM apps from the employer side in telecommunication companies?
RQ2: What are the challenges that can be highlighted in data mining with E-CRM apps in telecommunication companies?
To address these issues, we use minimum requirements to review previous academic studies.
Include the major contributions listwise:
- The framework can be applied to E-CRM applications where finding prospects for employee performance by purchasing a new product or introducing a service is required to customers.
- Moreover, it may contribute to some data mining fields.
RESEARCH BACKGROUND
An Overview of Data Mining
Is a complex topic of cloud computing that has piqued the interest of several scholars worldwide. According to Abu Ellaban (2013) reports DM is mostly reliant on various software methods that provide statistics and machine learning,” according to the research (Berson et. al., 2000). As a result, such technology aids the firm by converting enormous amounts of data into knowledge that administrators can use to make correct and effective decisions about active marketing campaigns and develop meaningful E-CRM operations. Data mining, according to many academics, is a sub-step of a larger procedure termed as "data mining.” According to Rygielski et al., (2002), data mining is the act of articulating what procedures should be performed to produce meaningful outcomes. They also say that data mining technology cannot work alone unless the user has a thorough grasp of the company, the material available, and is possibly aware of alternative statistical approaches. Data mining is the process of discovering patterns and relationships in data that already exist within an organization (Al-alawi and Alalawi, 2020). Data among all resources inside the business are saved in the company database system, which is then analyzed using data mining tools. There are several designs for data mining as workflows. The diagram in Figure1 illustrates.
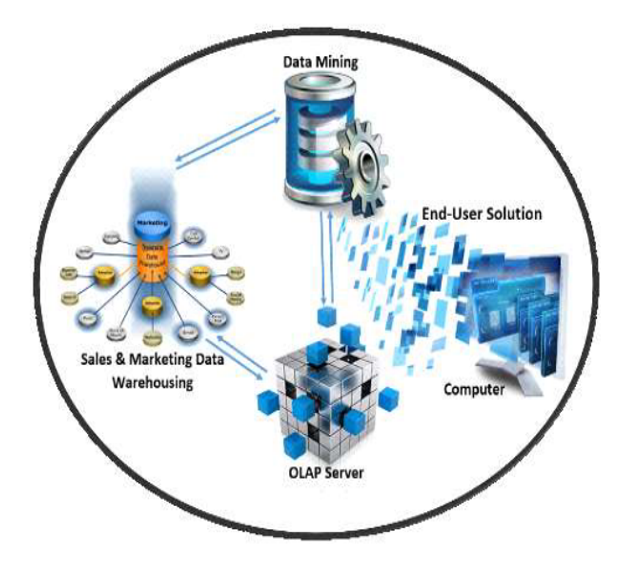
Fig 1. Data Mining procedure
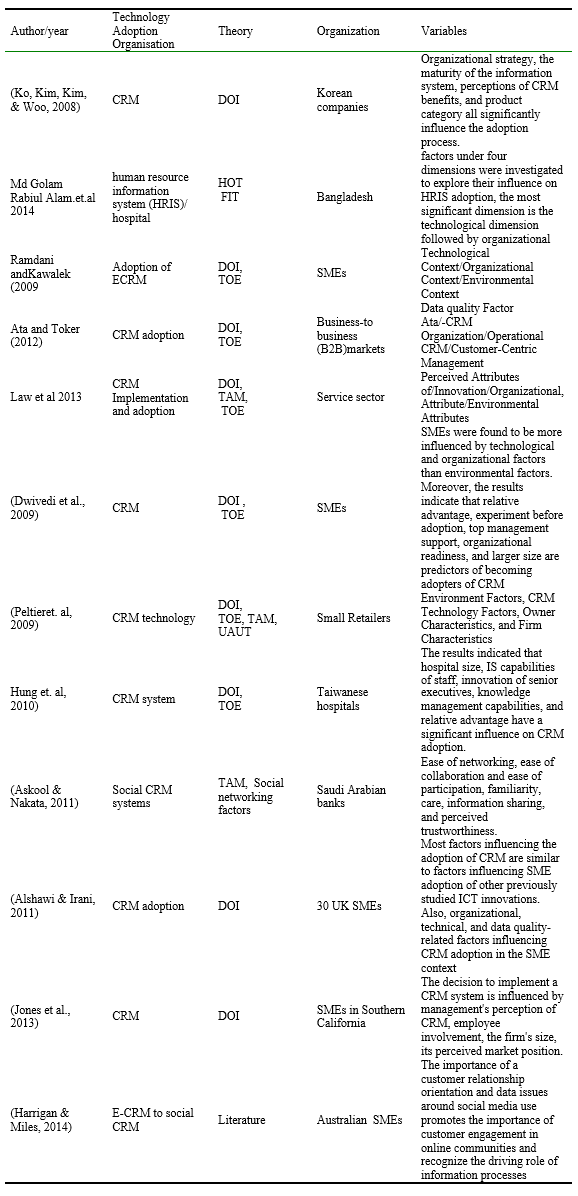
Analysis Previous Studies
According (Al-alawi and Alalawi, 2020; Malá, & Černá, 2012; Scherer & Teo, 2015) investigated the feasibility of applying data mining techniques in the telecommunications industry. Integration data mining techniques are employed to create a training dataset to facilitate repeat sales in the mobile telecommunications industry Ahn et al., (2011). As the telecommunications sector market expands, competitiveness within telecom companies has intensified. The app was installed to extend its output globally (Ahn et al., 2007; 2006). They utilize cutting-edge value-added services (VASs) to increase the average income of each user (ARPU). Marketing communication is also an E-CRM approach that mobile phone providers have utilized to boost profits and sales. In addition, Bahari & Elayidom. (2015) presented an improved CRM data-mining model for customer behavior forecasting. The E-CRM-data mining architecture is useful for managing customer-organization relationships (Pang et al, 2015). Data mining methods, such as classification, are often used in E-CRM (Jagadeesh Chandra Bose., & van der Aalst, 2009). Utilizing an inter-cluster analytical method to investigate commercial prospects in the user telephone service datasets (Bose and Chen 2010). The authors use customer segmentation techniques to determine which customers are most likely to use telecom applications. Chen et al., (2009) used customer purchase records to find recency, frequency, and monetary (RFM) cluster analysis. The majority of online merchants have established online data management that is used to maintain a huge quantity of client user information that is accessible over the Internet (Fuller et al., 2018). The authors present a pattern-categorization method for generating a worth up that can be used to make decisions. The suggested technique was evaluated using a customer transactional dataset and generated datasets contributed by a Taiwanese retail chain.
Tabla 1.
Analysis previous studies.
Challenges Data Mining in E-CRM Application
- There is an essential requirement for data combination in data mining. Data were gathered from a variety of sources for both cases. For example, in E-CRM, data might also be required from several divisions within an organization. As several intriguing correlations are found across numerous databases, data integration is required before data mining can begin.
- Develop a deep framework for employee attitudes. Understanding employees is one of the most essential issues in E-CRM. Employees' existing frameworks are primarily based on their buying and click behaviors on companies. Such frameworks are superficial and lack a deep understanding of employees and their unusual challenges. Consequently, numerous staff forecasts and behaviors are incorrect. When developing employee modeling, it is recommended that data from all employee points of contact be taken into account. This initiative must include marketing and psychological scholars. There are two special considerations to address in this case. To begin, at what levels must the employee framework be developed: at the aggregate level, segmentation level, or individual level? The level to which the E-CRM approach must be tailored is the determining factor. The second point to consider is the measurements that should be included in the employee list.
- Data gathering for E-CRM remains an issue in several companies' contexts. Several techniques are obtrusive and expensive. Data sources gathered are rather complex, come in a variety of forms, and are housed in several divisions within an organization. Several immediate post-difficulties must be solved for data mining techniques to work.
- Managing the starting issues. Very little is understood at the start of the employee life cycle; however, as time passes, the list of employees and the quantity of information available about every person grows. In most circumstances, only a small amount of data is required to provide satisfactory performance. Dealing with circumstances when less than the required limit is identified is thus a significant difficulty.
How Data Mining Techniques can be applied to E-CRM applications
E-CRM implementation employs data mining. The organization needs to comprehend clients to remain competitive (Seddon, 1997). Identifying and reacting to the requirements of customers, as well as enhancing employees’ service, are becoming critical components of company goals. CRM has greatly increased in recent years. Data mining methods have been shown to be beneficial to the sector, employee relationships, enhancing the employee experience, and employee loyalty is all parts of the relationship management cycle that data mining can help with (Mohamad et al., 2017; Anaam et al., 2018; Anaam et al., 2021). Evaluation is typically performed based on a user's demographic attributes, environment, and previous transactional history Ojiabo E, Bartholomew C, 2015. Employing artificial intelligence approaches, several data-mining systems routinely ex.
There are no sources in the current document
Amine the statuses of certain customer groups. They used beam scanning and high-dimensional approaches to create accurate profiles. Through more marketing strategies, data-mining algorithms can greatly boost consumer conversion rates. (Olavarrieta et al., 2008). The applicability of different classification techniques to E-CRM is as follows:
Categorization and forecasting
Data modeling is a type of data evaluation that can be used to derive a model for describing significant data categories or to forecast future complex data. Its goal is to create a framework that can anticipate the future behavior of employees by categorizing database records into a set of predetermined groups based on certain parameters. Forecasting simulates multiple input processes, whereas categorization forecasts classify (incomplete) values (Han and Kamber, 2006). Clustering algorithm classifiers, System is identified, Based on bayesian media platforms, rule-based classifiers, and linear regression are all common data categorization algorithms (Zhu et al, 2003). The estimation techniques include linear and non-linear regression.
Grouping
Grouping is the process of grouping databases in the same category. Grouping is mainly performed to provide an understanding of what is going on in the database to the service provider. Grouping can help you get a birds-eye understanding of the market (Almana and Alzahrani, 2014; Awa et al., 2015).
Evaluation of Correlation
When one of the independent factors is changed, whereas the other study variables remain constant, linear regression can assist in understanding how and why understanding this concept of the value is determined. Correlation testing is frequently used for modeling and analysis.
Visualization
The presentation of complicated structures so that viewers can see them is referred to as visualization. According to Friedman (2008), the basic purpose of data visualization is to present information simply and successfully through visual techniques. It is used in conjunction with other data mining techniques to provide a comprehensive discussion of the relationships among variables that have been uncovered.
Employee Classification
The major goal of CRM is to build a long-term, lucrative connection with clients. The goal of E-CRM is to please employees who have proven to be useful to the firm, rather than to satisfy all employees. As a result, in designing and evaluating E-CRM, we must first determine the most valuable employee. Furthermore, the solution provider is required to assess whether their large employees might be useful in utilizing this information (Chang et al., 2015; Ahn, Kim, & Han, 2006 (Anaam, Abu Bakar et al., 2020). As a result, it is critical to identify the "proper" consumers via exploiting or mining the prior database, as well as to utilize this information to effectively order to achieve projects tailored to the customer's preferences. Employee categorization is a technique of identifying the right employee based on their data. In marketing, employee categorization is a critical problem. It is thought that the more knowledge a company has about its employees’ attitudes and behaviors, the better. The more successful the marketing tactics that can be devised, the better. As a result, multiple kinds of research on the development of successful consumer categorization algorithms has been conducted. On the other hand, most of this research is focused on a complete data mining approach. Limited approaches have been adopted to use multiple methods independently and integrate the results for employee categorization.
Employee Performance Anatomy And Detention In Telecommunication Companies
The telecommunications sector has seen significant transformations in recent decades, including the development of new services, technical improvements, and more competitiveness as a part of globalization. Employee performance estimation in the telecommunications sector has therefore become critical to industry participants in order to defend their loyal employee base, develop their businesses, and enhance E-CRM (Wisesa and Khalaf, 2020; Al-alawi and Alalawi, 2020; Dauwed et al., 2018). Several of the most difficult issues in the telecommunications companies sector are sustaining consumers with a high churn risk (Shokouhyar et al., 2018). Employees currently have a range of churn alternatives due to the increased number of telecom operators and increased competition (Li & Mao, 2012). As a result, telecommunications companies are realizing the significance of maintaining current employees rather than gaining new models.
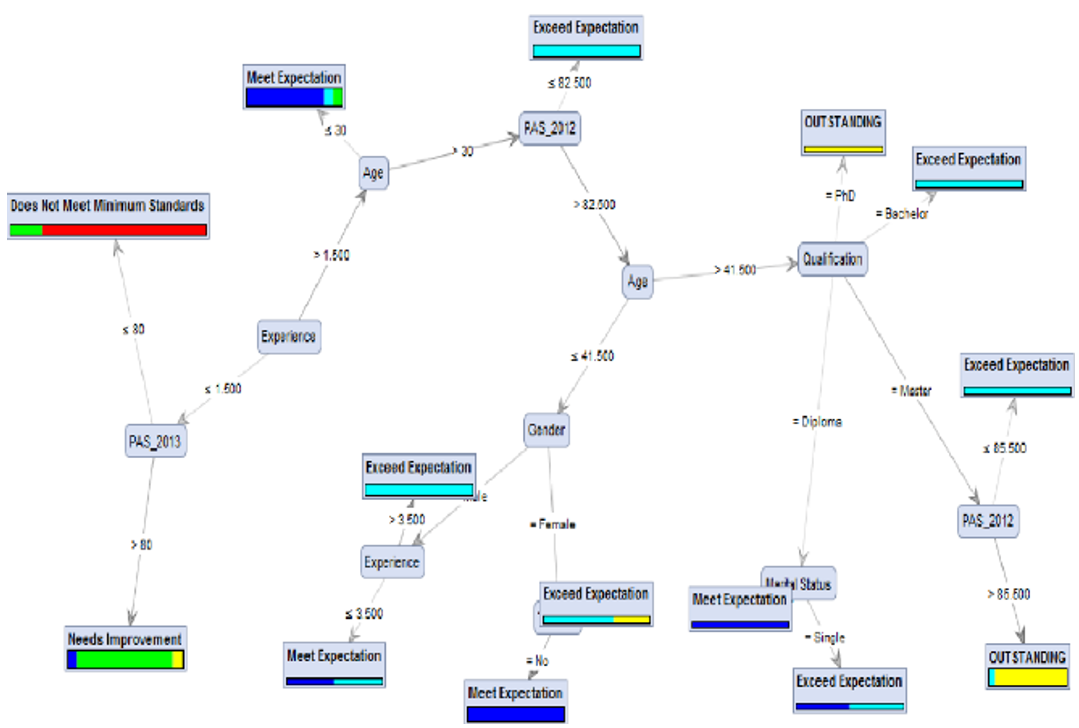
Fig 2. Employee Performance Anatomy.
Methodology
Classification Process
Because the complexity of E-CRM and data mining analysis makes it difficult to limit it to a single subject, relevant resources are dispersed across a variety of periodicals. As a result, to establish a thorough reference, the preceding online library databases were selected. of the E-CRM and data mining empirical studies: Google Scholar, Web of Science. Every paper's full content was scrutinized to exclude those who were unrelated to the use of data mining algorithms in E-CRM. The following are the requirements: Only publications that established how the aforementioned data mining method(s) might be implemented and aided in CRM tactics were chosen.
Design Framework for Data Mining Techniques in E-CRM
The analysis data were gathered from a major telecommunications service provider. As a result, telecommunications companies grew increasingly responsible for obtaining value-added services (VAS) in terms of increasing E-CRM and enhancing their business performance. We developed a customer categorization framework based on this motive to identify potential customers for the company's VAS among consumers of its ordinary telephone communication system. The ring tone distribution service was chosen as our goal VAS because it was thought to be the most commercially viable.

Fig 3. Classification Framework For Data Mining Techniques in-CRM.
In addition to the difficulties of creating consumer frameworks, assessing individuals is a significant undertaking. Currently, there is no appropriate metric for determining whether one model is superior to another or that a model is superior to a framework. Employees’ behaviors were accurately reflected in the framework. However, there are some parameters for assessing the performance of employee frameworks. Primitive and new measurements are urgently needed. In a study of the research on data mining approaches in E-CRM, a data visualization categorization framework is suggested and displayed in Fig 3. CRM data-mining techniques Examining academic papers on E-CRM data mining analytically aided in the identification of key E-CRM dimensions, and data mining algorithms are used to apply data. E-CRM approaches for data mining. It describes CRM dimensions as employee identification, employee attraction, employee retention, and employee development. Moreover, segmentation, categorization, prediction, regression, material characterization, and image processing are examples of data-mining models.
Adopt AHP Method 6 Update DeLone & Mclean for determined Key Factors to Data Mining Techniques with E-CRM
AHP is an analytic hierarchy process (AHP) proposed and developed by Saaty (1977). AHP is a multi-criteria decision-making process that has been widely employed in a variety of applications over the years, including education engineering (Kengpol and O’Brien, 2001), industry (Noci and Toletti, 2000), manufacturing (Albayrakoglu, 1996), and resource allocation (Saaty, 1980). In the realm of communication and information technologies, AHP has recently been widely employed to evaluate and rank options(Dede et al., 2011; Chiu, 2002; Nikou et al., 2011). Additionally, DeLone and McLean (2003) comprehensively evaluated various IS success measures and suggested a six-factor IS success model as a classification and model for measuring complex-dependent variables in IS research. Information quality refers to the quality of information created by a system (DeLone and McLean, 2003). Information quality is relevant to the effectiveness and employee satisfaction of ISs. Service Quality: The updated model of IS success added service quality to the old model and mentioned the critical effect of service quality on IS success. Information quality and system quality may be used to estimate the performance of the system itself, while service quality is the most important aspect of overall IS performance.
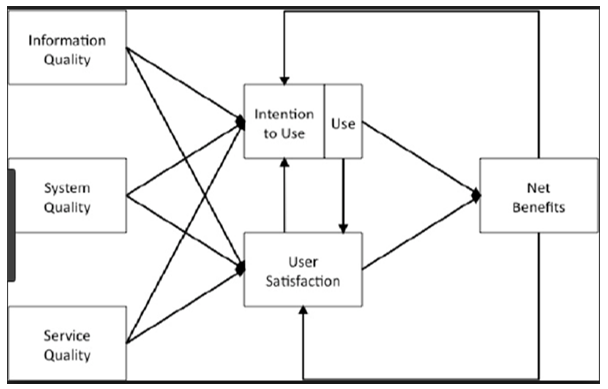
Fig 4. Update DeLone and McLean techniques.
Hypothesis Development
As a result, two theoretical approaches are utilized to investigate this continued usage behavior: PHP and DeLone and McLean. The study model is depicted graphically in Fig. 2. The establishment of the hypotheses is further described in the following sections.
H1: There Is A Significant Relationship Between Service Quality And Employee Satisfaction
This hypothesis is supported by researchers such as )Jun and Kim, 2004; Lee, 2004), who confirmed that the quality of the system has an essential association with usefulness. Additionally, Sönmez (2018) examined the impact of service quality on customer satisfaction and found that perceived service quality has a positive effect on user satisfaction. Chinje (2013) also confirmed that service quality has a positive impact on user satisfaction.
H2: There is a Meaningful Relationship Between System Quality and Employee Satisfaction.
The system quality depends on the user's needs while using the system. Additionally, (Anaam, Bakar et al., 2020); Kooper and Maes (2011) described that system quality is obtained through the interaction of users through work. DeLone and McLean (2003) suggested that system quality leads to high user satisfaction. Chen et al. (2015) and H. A. Reijers (2020) claimed that system quality has a significant effect on perceived usefulness and employee satisfaction. It is clear that system quality has a considerable influence on satisfaction, as indicated by DeLone and McLean’s model (Alatawi et al., 2013).
H3. There is a Meaningful Relationship Between Information Quality and Employee Satisfaction.
Wu et al., (2010) found that information quality had a positive impact on perceived usefulness. In contrast, Chen et al., (2015) claimed that information quality has a significant effect on perceived usefulness and employee satisfaction. Alshibly and Chiong (2015); Kooper et al, 2011; Karimi & Tan, (2015) suggested that information quality positively influences perceived usefulness and satisfaction. Scheepers et al., (2006) found that information quality is positively related to employee satisfaction. Moreover, Coombs et al. (2001) recommended that enhancing information quality will improve employee satisfaction. Yusof & Aziz (2015) also claimed that information has a significant effect on employee satisfaction.
Results
Convergent Validity of Technology Factors
Depicts the convergent validity of the formative measurement model for technology factors, specifically system quality (SQ), information quality (IQ), and service quality (SERQ). The results show that the path coefficients and R2 are above the threshold values (0.70 / 0.50), indicating that the set of all items in each construct (System Quality (SQ), Information Quality (IQ), Service Quality (SERQ)) contributes theoretically and empirically in shaping the constructs of system quality (SQ), information quality (IQ), and service quality (SERQ).
Fig 5. Convergent Validity of Technology Factors.
Assessing the Predictive Relevance Q Square (q2) using Blindfolding
The study used Stone-Geisser’s Q2 value to examine the predictive relevance or predictive power of the developed research model, particularly the effect of the magnitude of the exogenous constructs (e.g., technology, organization, and individual factors) on the endogenous constructs (perceived usefulness (PU), employee satisfaction (ES), and individual performance (IP)). As recommended by Hair et al., (2017), the blindfolding procedure should be conducted only on the endogenous latent variables with a reflective measurement model, focusing on the results of construct cross-validated redundancy. Q2 values larger than zero for a certain reflective endogenous latent construct reveal the path-developed model’s predictive power/relevance for a particular endogenous variable. Guidelines for assessing Q2 are that values of 0.35, 0.15, and 0.02, respectively, represent large, medium, and small effects (Hair et al., 2016; Kim et al., 2015), which refers to the relative measure of the predictive power of the hypothesized model. The results of this measure fig 7 show that all exogenous constructs (technology, organization, and individual factors) have large predictive power/relevance in the developed model on the endogenous constructs. The resultes SSO(1,500.000, 1,800.000,1,500.000) while, SSE(853.555, 1,251.009, 993.074) Q² (=1-SSE/SSO) 0.431, 0.305, 0.338) all values confirm are large.
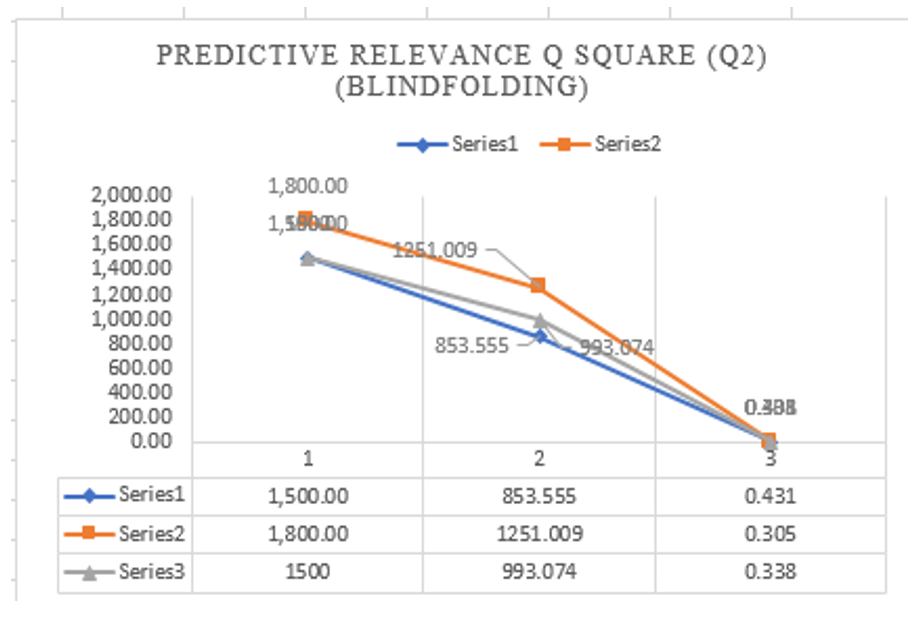
Fig 6. The Predictive Relevance Q Square
Common Method Bias (CMB)
To test the validity of the collected data set using a self-reported technique, the common method bias–one-factor method for common variation was conducted (Podsakoff et al, 2003), which refers to a bias in the collected data set, which is external to the measures. For example, in the current research, a self-reported technique (i.e., questionnaire) was used to collect data. Therefore, any bias occurs in the data set because the questionnaire is called common method bias (CMB). Using exploratory factor analysis and Principal Component Analysis that generated the one-factor variance called “Harman Single Factor” Podsakoff et al., 2003; (“the value less than 50% disclose the absence of common method bias in the set of collected data (Hair et al., 2010), Total Variance Explained of 36.879 generated, as presentedFig 8, which is less than a threshold value of 50% that concludes that the absence of common method bias in the current data set.
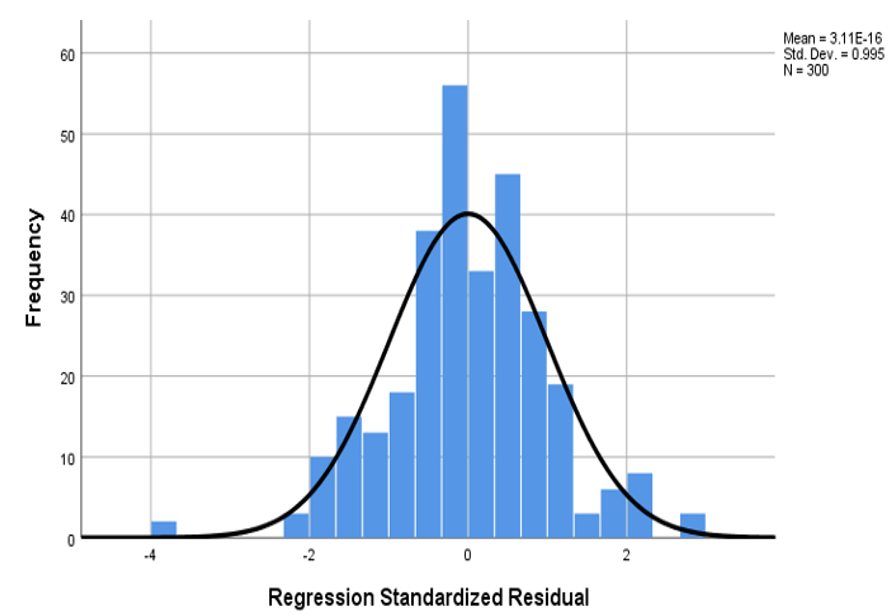
Fig 7. Common Method Bias.
Technology Factors with Employee Satisfaction
This means that 6% of variance in employee satisfaction (ES) is jointly explained by technology factors (TF) via perceived usefulness PU. In other words, the effect of technology factors (TF) on employee satisfaction (ES) via employees’ perceived usefulness (PU) as mediation is around 6%. Furthermore, the Monte Carlo method for testing mediation illustrates that H10 is statistically significant in that the lower limit (LL) (0.0257) and upper limit (UL) (0.0929) of confidence interval (CI) bias corrected using the Monte Carlo method are located on the positive side (Figure 4.24), validating the significance of the hypothesis. In addition, the indirect path coefficient (β) ranges between LL (0.0257) and UL (0.0929) according to the Monte Carlo method. This means that the effect of technology factor on employee satisfaction (ES) via employees’ perceived usefulness (PU) as mediation ranges between LL (0.0257) and UL (0.0929) using the Monte Carlo method, which is typical of the results of the bootstrapping method.
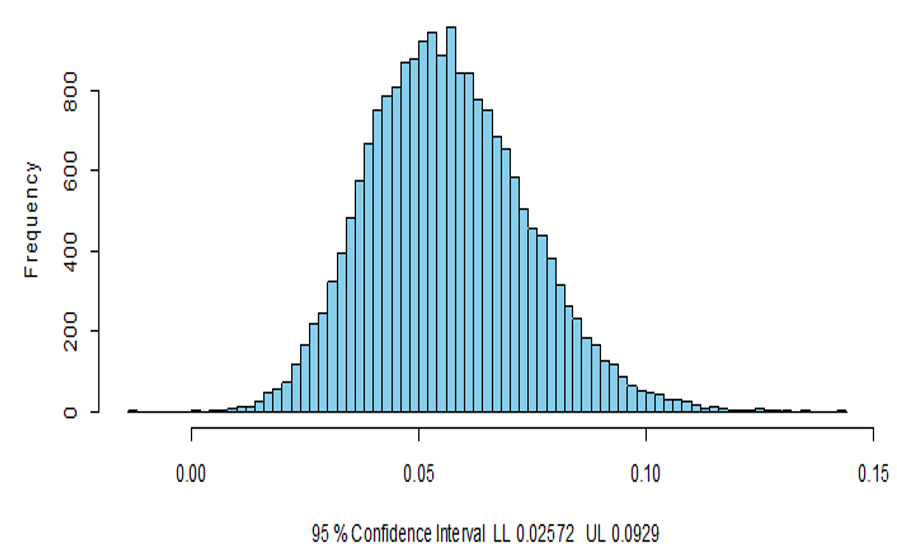
Fig 8. Monte Carlo Method for Testing Mediation.
Detrended Normal Q-Q Plots for Normality Assessment of technology Factors
Fig 9. Plots for Normality Assessment of technology Factors.
Outliers Assessment for All factors of Framework
Outliers were achieved by plotting the actual deviation of the score from a straight line. The collected data set should be within the range of ≤ 3.0. Normal Quantile-Quantile (Q-Q) plots are presented in Fig 10 (C) for System Quality,
Information Quality.
Fig 10. Outlier for factor framework.
Conclusion
In this study, we propose a unique predictive model that effectively combines many heterogeneous detectors. In the internationally saturated information economy, an E-CRM platform based on data mining techniques is becoming critical for businesses to succeed. Data mining is no longer limited to customer interaction level electronic customer relationship management as the assumption and framework of E-CRM. Consequently, for scenarios with ambiguous patterns, this technique may not produce explicit findings. Nonetheless, it has the potential to significantly improve prediction performance. We indicate that the proposed framework can enhance prediction accuracy in the case of employee segmentation based on the outcomes of the investigation, even though the coverage ratio decreases slightly. The framework suggested in this study appears to be highly effective in various domains where significant predictive performance for restricted cases is required. This article's recommended employee performance application is a suitable illustration. The technique can be used in factors that may influence E-CRM sectors when identifying potential customers for a product/service is necessary). It can be seen that the values of the collected data for the set of variables are in the area less than 3, concluding that the absence of outlier assumption is met, indicating that the data on the set of variables in the current study are normally distributed.